Investors and developers need to know if wind farms are producing enough power to hit their budgets. K2 Management uses machine learning to quantify energy losses with 35% more accuracy than industry-standard methods. Comparing our machine learning power predictions to real measurements helps us to improve our models and demonstrate the value of our approach as compared to the industry-standard approach.
When a wind turbine isn’t operating – or isn’t operating at its optimum level – then the opportunity to generate electrical energy is lost. Those losses must be quantified, so that the performance of the turbine and the amount of revenue it generates from its power can be compared to its budget.
K2 Management’s machine learning method outperforms industry-standard approaches consistently, with an improvement in power prediction accuracy of up to 35%. This improvement results in more accurate estimates for wind farm production losses and less uncertainty in energy yield estimates.
Why current industry models need improvement
The industry’s standard method for estimating wind farm production losses uses simple nacelle anemometer power curves derived from the operational Scada data recorded at each turbine. This method assumes wind speed is the sole driver of power generation.
In reality, turbine performance can vary due to other atmospheric conditions, including air density, turbulence, wind shear, and the angle at which wind flows into the rotor. While some attempts have been made by others to improve the traditional model – including grouping measurements together according to the calendar month as a way of approximating certain atmospheric conditions – the improvement in accuracy is limited and is specific to each wind farm.
Going beyond the industry standard
K2 Management uses machine learning as standard on all Scada-based energy yield assessments to predict the lost production caused by turbine downtime and underperformance. This approach not only takes into account wind speed but also other standard Scada variables – including the ambient air temperature and the direction in which the nacelle is pointing – as proxies for other atmospheric conditions that may affect power performance.
This technique makes the best use of the valuable information from Scada systems to provide the most accurate loss calculations. Understanding losses then allows comparisons to be made with the power output predictions made in a wind farm’s budget.
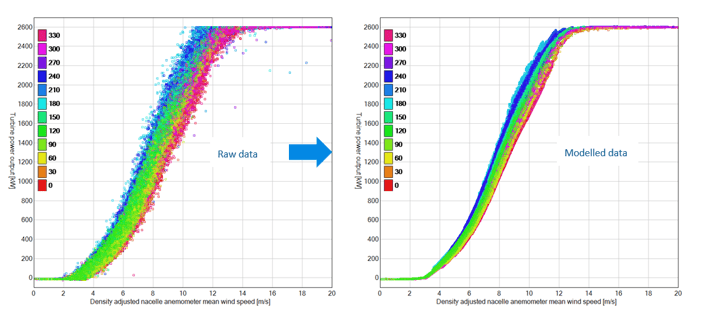
The figure below shows an example of the K2 Management machine learning power prediction model capturing variations in power performance resulting from changes in the wind direction at a particular site.
Validating our machine learning method
K2 Management has demonstrated the value of this approach by comparing machine learning power predictions to real measurements produced when turbines are operating normally at a variety of wind farms. The machine learning predictions have been compared to each of the industry’s standard power curve methods.
In all cases, the difference between K2 Management’s machine learning power predictions and the real measurements was less than that calculated by the method most commonly used in the industry. The reduction in this difference is up to 35%.
Why validating our methods is so important
Validating our techniques is key because it allows us to close the gap between computer models and reality. Having the most accurate information available then allows us to help our clients to optimise the performance of wind farms.
Validation means we can prove that we’re getting better and better as we make each improvement to our models. By gathering information from sites throughout the world, we’re able to keep improving the accuracy of our data and our models.
Validation results
For all sites considered, the plot on the left below shows that the difference between K2M’s machine learning power predictions and the real measurements is less than the other traditional methods most commonly used in the industry.
Several turbines were selected, representing the full range of conditions observed at each site. In all cases, the plot on the right below shows that the difference between K2M’s machine learning power predictions and the real measurements is less than the method most commonly used in the industry. The reduction in this difference is up to 35%.
-2.png?width=700&height=322&name=Untitled%20design%20(10)-2.png)
Read more about our services:

Share:
Related News