Share:
Related News


Do you trust fuel economy figures listed in a new car’s sales brochure?
These figures are unrealistic and generally the outlined mileage is only reached under rare, optimal conditions. The same can be said for power curves provided by turbine manufacturers, as these figures are often measured at flat, non-forested test sites.
Turbines are rarely installed under ideal conditions, as many top tier sites have already been taken or are unsuitable due to things like land-lease opportunities, access to the grid, etc. This means that turbines don't produce the amount of energy indicated in the sales brochure or power curve and the resulting yield estimate is too optimistic.
Predicting how a wind turbine will actually perform on a specific site is challenging. The wind conditions at each location are affected by a large number of factors; height, density and location of trees, hillsides, steep slopes, wind direction, atmospheric conditions and many more.
Having analysed 1000+ wind farm sites, K2 Management has seen overpredictions and underpredictions to varying degrees. General industry bias is around 5-10% overprediction. For a 50 MW project, this could represent a shortfall of as much as 13 GWh of energy production annually. A significant proportion of this shortfall can be tackled with improved turbine performance modelling.
How can developers get a realistic picture of expected performance?
To get more accurate performance expectations, several ingredients, such as wind speed, turbulence and shear, must be included. Even though some manufacturers provide site-specific sales curves, these can only reflect performance in a narrow range of conditions rather than the wide range experienced at turbine locations across real wind farm sites.
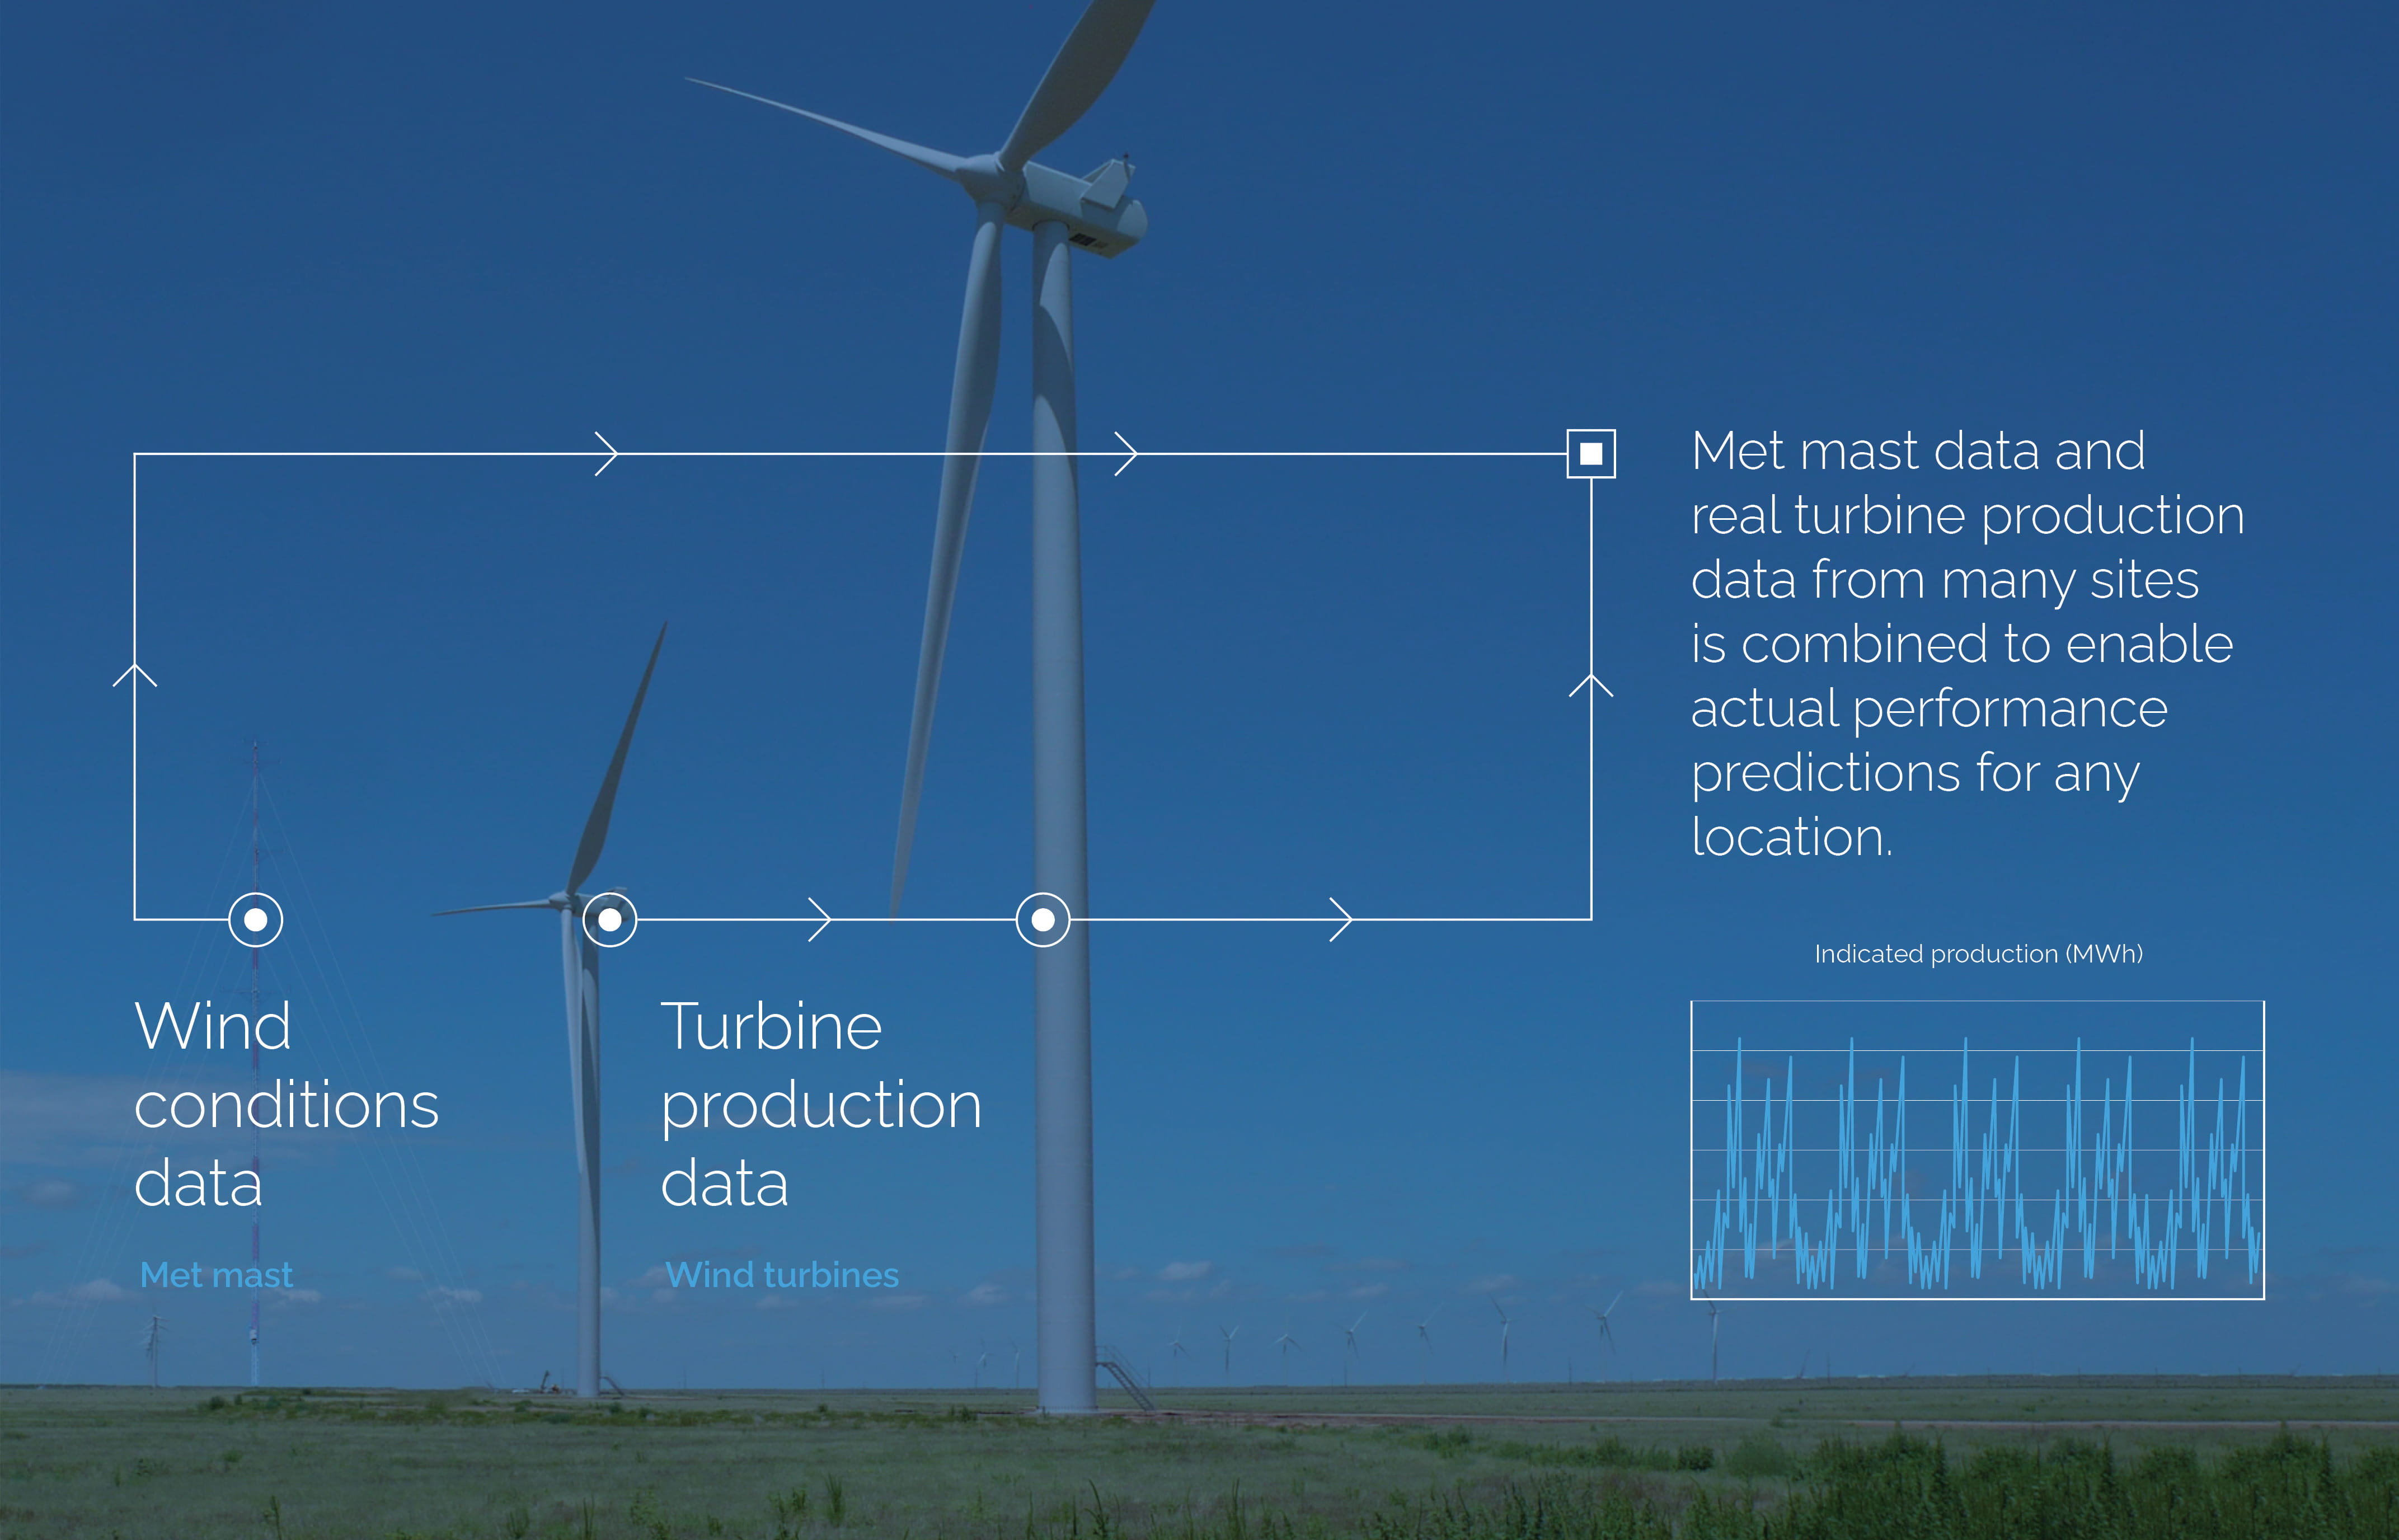
K2 Management has combined high-quality wind measurements and turbine production data, then used aerodynamic theories to causally relate the datasets. Data from over 100 turbines at more than 20 wind projects globally has been processed, developing a universal and accurate model of real-world turbine performance. The more projects we assess, the more we refine our model.
In short, we mix local wind measurements with industry-leading computational fluid dynamics models to understand how the wind will actually behave at every proposed turbine location on-site. We then combine this knowledge with our causal turbine performance model to predict the energy yield at every individual turbine location more accurately than with the power curve alone.
For clients, this regularly leads to energy production estimate improvements of around 2%. This adjustment can be up or down depending on the specific situation being considered.
As one of our clients recently said: “There is no one out there better than K2 Management <at analysis>. Maybe one or two are on par, but no one is better”.
Want to talk about how to get a realistic picture of expected performance? Get in touch with us below..